Running the ELK Stack on Scalingo

The Elastic Stack (formerly known as the ELK Stack) is a powerful collection of softwares that lets you collect data from any source using any format. It gives you the tools to search, visualize and analyze it in real time. This article will show you how to configure and deploy this stack on Scalingo in less than 5 minutes.
This stack can cover many different use cases, from IoT devices tracking to data aggregation, but the most well-known use case of these tools is to parse, store, index, search and visualize logs from multiple different sources.
What is the ELK Stack?
The ELK stack is based on three major components:
- Elasticsearch
- Logstash
- Kibana
Elasticsearch is a distributed full-text search engine, able to store JSON document and index them efficiently, it is responsible for the storage of all the incoming data.
Logstash is a data processing pipeline, any source sends data as input. It is able to format and modify data on the fly before forwarding it to the chosen destination (usually an Elasticsearch database).
Kibana is a powerful web-based data visualization tool providing everything you need to explore your data and build useful and efficient dashboards.
Logstash
Let's start by bootstrapping the Logstash container. This instance will take his data from an authenticated input and send them to an Elasticsearch database. This is the EL part in ELK.
Fortunately, our mighty John wrote a nice Logstash boilerplate to get you started. This repository contains different examples of configuration and the required files for the deployment.
$ git clone https://github.com/Scalingo/logstash-boilerplate
$ cd logstash-boilerplate
Next, create an application on Scalingo that will run our Logstash app:
$ scalingo create my-awesome-logstash --buildpack https://github.com/Scalingo/multi-buildpack.git
Add the Elasticsearch addon to this application:
$ scalingo --app my-awesome-logstash addons-add scalingo-elasticsearch 1g
All the Elasticsearch plans are described here.
Of course, not everyone should be able to send data to your Logstash instance, it should be
protected via HTTP basic auth. It is already handled in the boilerplate but the
environment variables USER and PASSWORD should be set first.
$ scalingo --app my-awesome-logstash env-set USER=my-awesome-logstash-user PASSWORD=iloveunicorns
Edit the logstash.conf file to change the index name of the Elasticsearch
output. The goal is to make it fit semantically to the data which will be
stored:
output {
  elasticsearch {
    [...]
    # OLD
    index => "change-me-%{+YYYY.MM.dd}"
    # NEW
    index => "unicorns-%{+YYYY.MM.dd}"
  }
}
Commit your changes
$ git add logstash.conf
$ git commit -m "Update the index name"
And you're all set, just git push scalingo master and your Logstash instance
will be up and running!
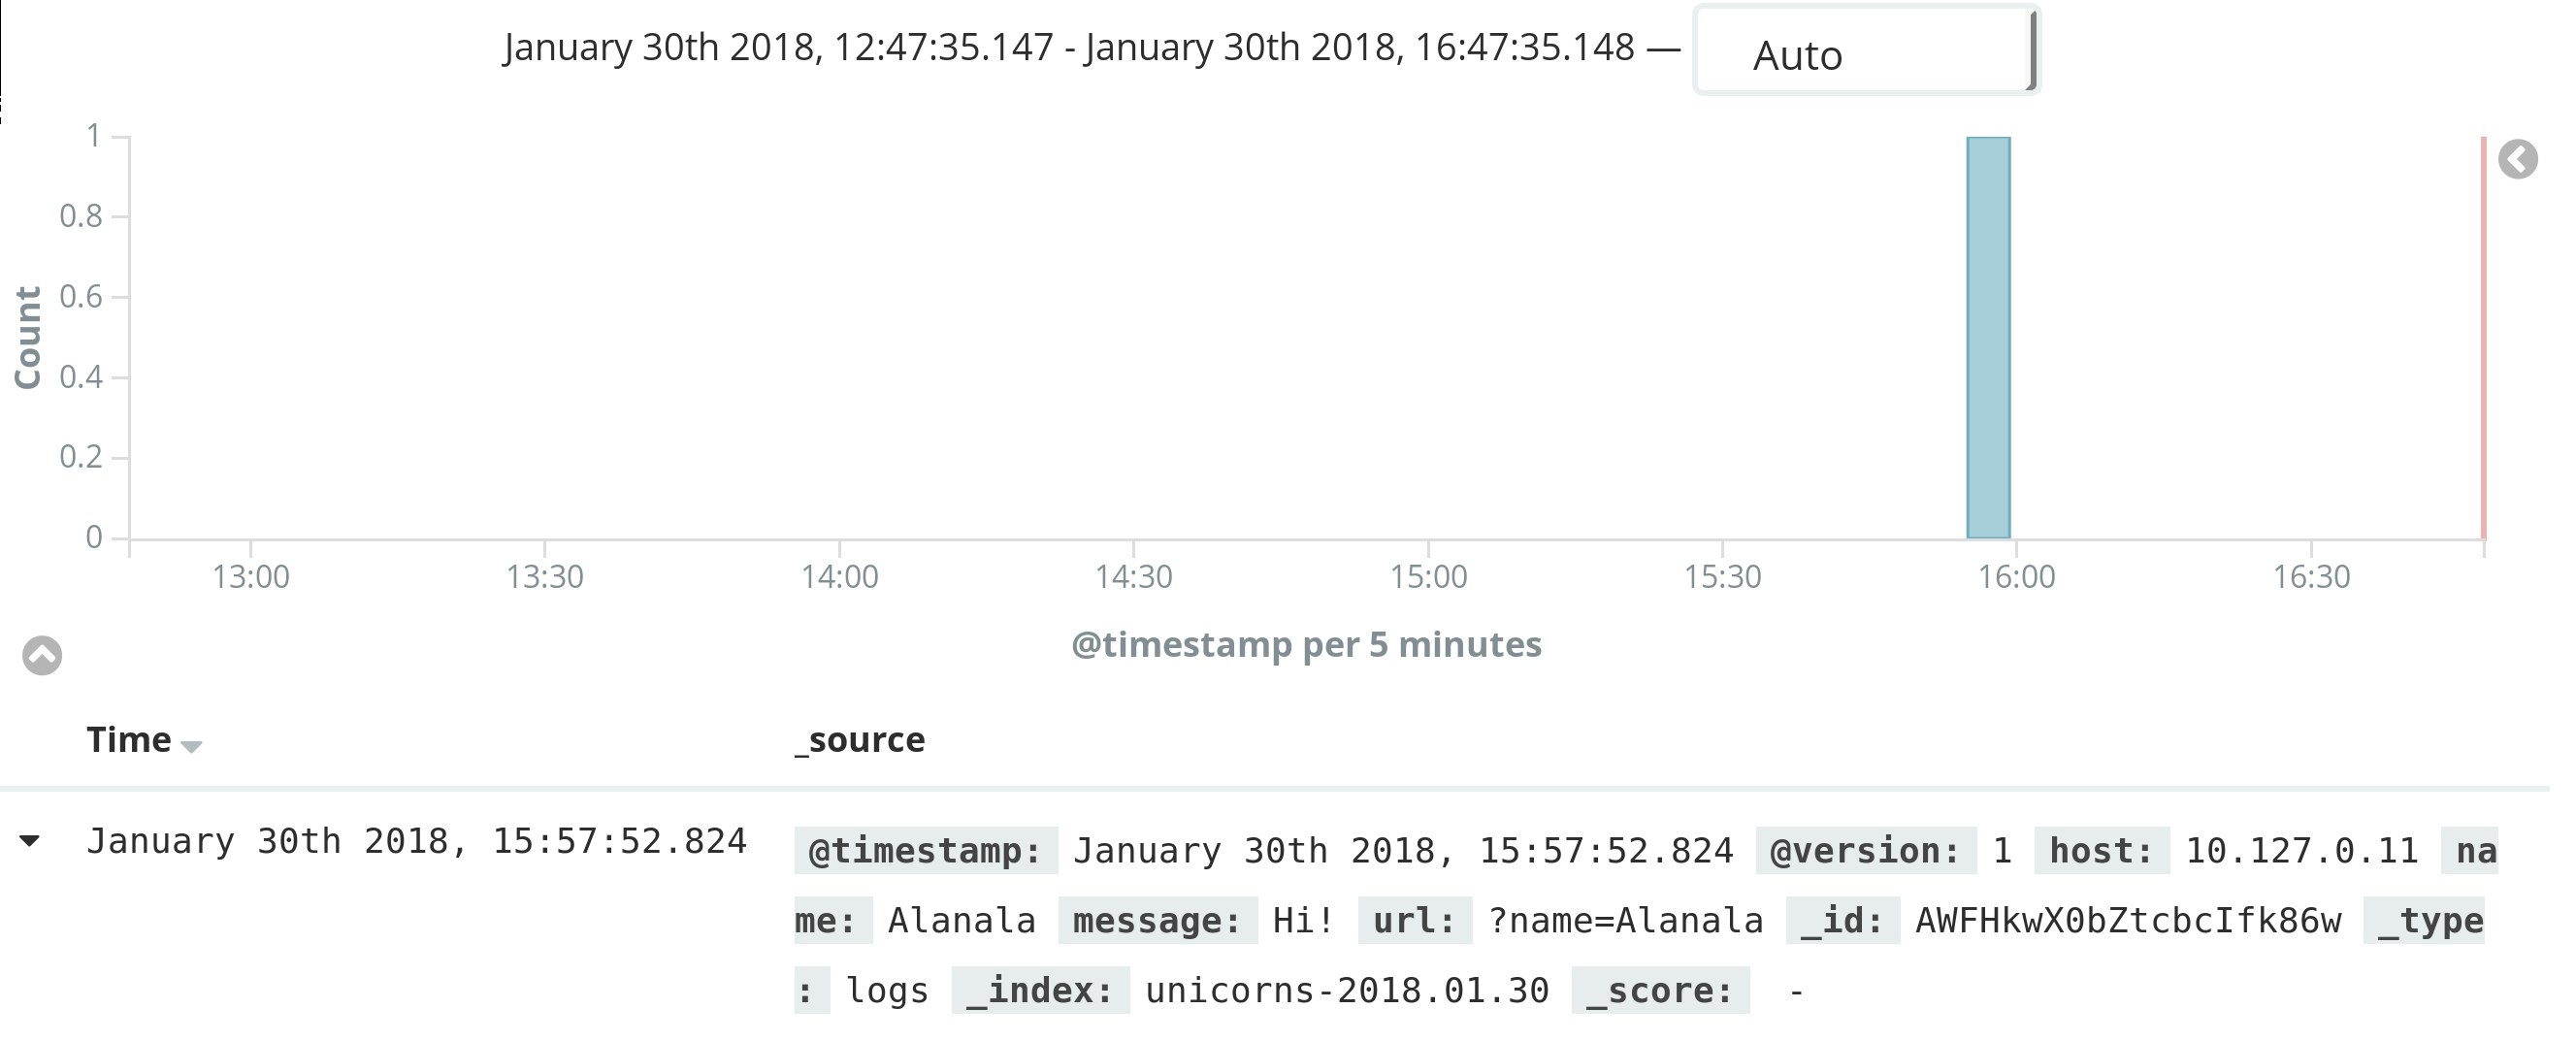
You can now try to send some data to your Logstash instance:
$ curl --request POST 'http://my-awesome-logstash-user:iloveunicorns@my-awesome-logstash.scalingo.io?name=Alanala' --data 'Hi!'
ok
It's time to verify all the indices that are stored in the Elasticsearch database:
$ scalingo --app my-awesome-logstash run bash

> curl $SCALINGO_ELASTICSEARCH_URL/_cat/indices
yellow open unicorns-2018.01.26 _0XNpJKzQc2kjhTyxf4DnQ 5 1 1 0 6.6kb 6.6kb
Logstash has created the unicorn index which can now be requested:
> curl $SCALINGO_ELASTICSEARCH_URL/unicorns-2018.01.26/_search | json_pp
{
   "_shards" : {
    // [...]
   },
   // [...]
   "hits" : {
      "total" : 1,
      "max_score" : 1,
      "hits" : [
         {
            "_type" : "logs",
            "_score" : 1,
            "_source" : {
               "name" : "Alanala",
               "message" : "Hi!",
               "url" : "?name=Alanala",
               "@timestamp" : "2018-01-26T11:57:03.155Z"
               // [...]
            },
            // [...]
         }
      ]
   }
}
The result of the above search contains a document having with a field name
set to Alenala and a field message set to Hi!.
Anatomy of the Logstash boilerplate
To achieve the previous result, the boilerplate is structured around three different files:
The first one is the .buildpacks. This file defines how this application must
be built. In this case, Java has to be installed first, then the Scalingo
official Logstash buildpack
should be run to install Logstash.
More information about the multi-buildpack feature can be found in our documentation.
The second one is the Procfile which defines the command to start the application.
web: bin/logstash -f logstash.conf
This Procfile defines that the web container (default) will invoke the
Logstash deamon, so any command line
flags
accepted by the Logstash agent, can be used.
The boilerplate only uses the flage -f which specifies the path to the
configuration file.
Last but not least, the logstash.conf is defining the Logstash
pipeline.
In this case, this file is pretty simple, let's break it up:
The first section is the input
section,
using the http-input
plugin
which will create a HTTP server listening on to the $PORT port and which will
only accept authenticated connections.
input {
  http {
    port => "${PORT}"
    user => "${USER}"
    password => "${PASSWORD}"
  }
}
The next section is the filter block, this is usually where all the magic happens.
filter {
  grok {
    match => [ "[headers][request_uri]", "%{URIPARAM:url}" ]
    remove_field => ["headers"]
  }

  kv {
    source => "url"
    field_split => "&"
    trim_key => "?"
  }
}
This first filter applied invokes the grok
plugin
to get all the URI parameters and store them in the url field. This is done
by applying the
URIPARAM
pattern to the request_uri header. Next the grok plugin will discard all the
headers since they are not needed anymore.
From the previous example, There would be a url field containing:
?name=Alanala
The second used filer is the kv plugin to parse the above string and define the corresponding fields.
After all the pipeline, the indexed document will look like:
{
  "message": "Hi !",
  "url": '?name="Alanala"';
  "name": "Alanala",
}
The final section is the output. The configuration about the destination of the generated data is defined here. In the boilerplate, the target is an Elasticsearch database.
The Elasticsearch plugin is used to achieve this.
output {
  elasticsearch {
    hosts => "${ELASTICSEARCH_HOST}"
    user => "${ELASTICSEARCH_USER}"
    password => "${ELASTICSEARCH_PASSWORD}"
    index => "unicorns-%{+YYYY.MM.dd}"
  }
}
This setup pretty awesome but not really useful in real life. It would be nice to send structured data to the Logstash server and define several fields. Here comes the filters. We'll cover 2 types of filters: JSON and Key/Value.
JSON Filter
Data sent to logstash can be encoded to JSON. To parse it, The filter pipeline has to be slightly modified, by adding JSON filter plugin:
filter {
  grok {
    // [...]
  }

  kv {
    // [...]
  }

  json {
    source => "message"
  }
}
The source attribute of the JSON filter plugin indicates which field will be
interpreted as a JSON string.
Key/Value Filter
Another method is to use key-value formatted logs. Those type of strings are often used in application logs since this format can easily be read by computers and by humans. This format looks like:
time=2018-01-30T16:00:57 code=500 error="fail to get users: database timed out" message="users list failed" application=app-123456-789 request_id=2222-22222-2222-2222 request_time=10s
To parse those kind of logs, the KV filter plugin can be used.
By default, this plugin works on the message field, so the configuration section on the logstash.conf file
add is minimal:
filter{
  // [...]

  kv {
  }
}
But to prevent important keys from being overwritten, adding a prefix to the keys generated by the kv filter is recommanded:
  // [...]

  kv {
    prefix => "msg_"
  }
}
Kibana
To deploy Kibana on Scalingo, you are invited to use our one-click button just over here:

The ELASTICSEARCH_URL environment variable from the previously created
Logstash application should be used in the deployment process:
scalingo --app my-awesome-logstash env | grep SCALINGO_ELASTICSEARCH_URL
Then, a username and a password should be defined for to configure Kibana authentication.
Once deployed, index patterns need to be configured. This is required to inform Kibana about the indices of Elasticsearch it need to look at.
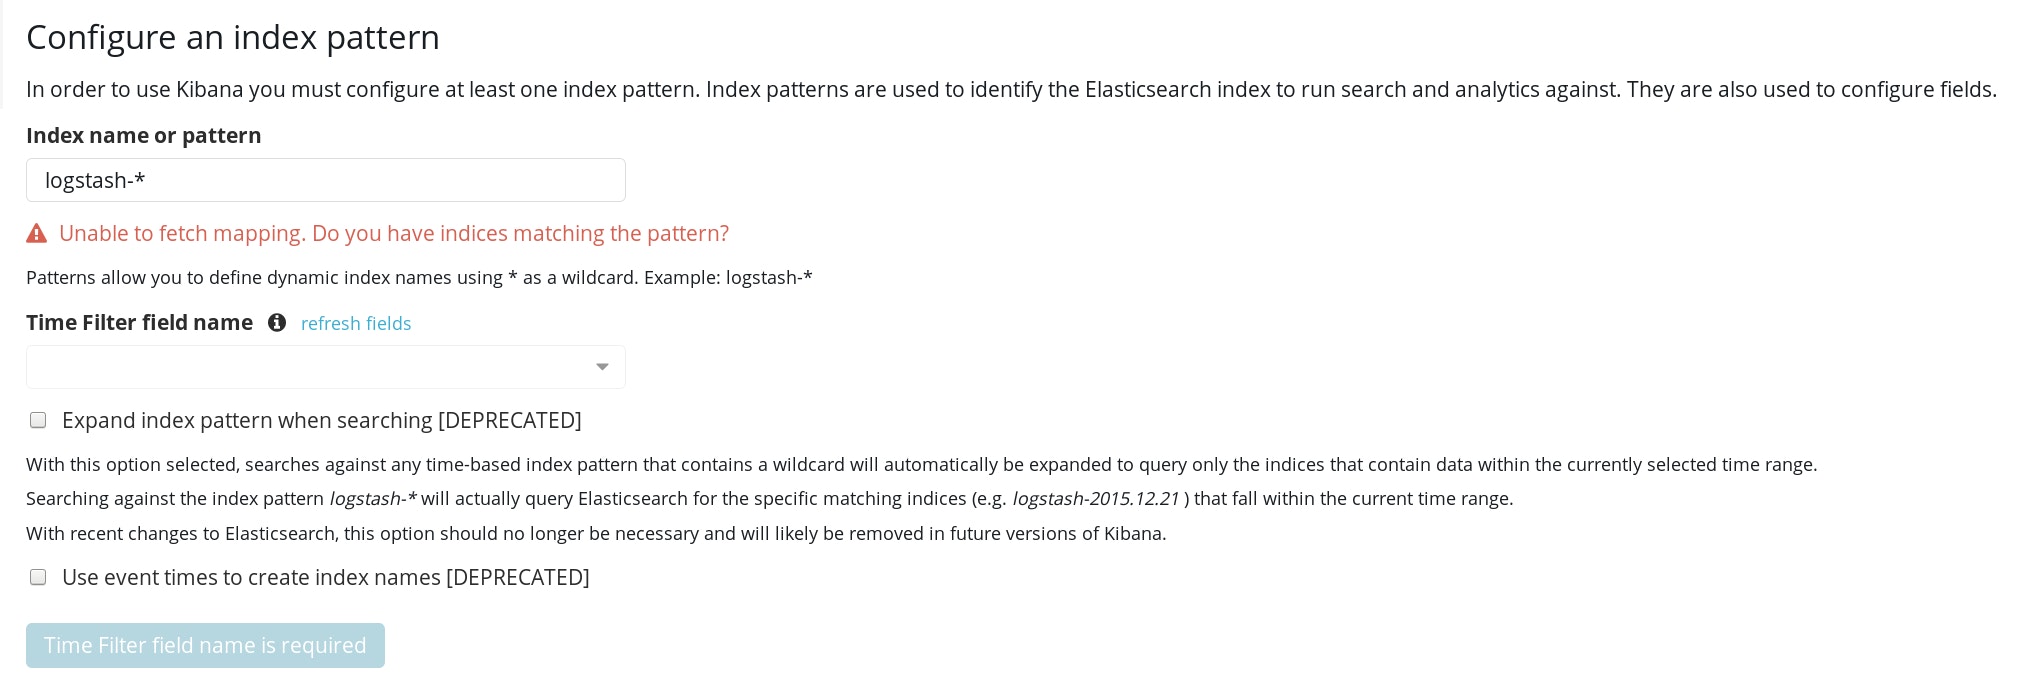
In this example, the unicorns-* pattern will be used.
Click on create and you're all set, the test input done in the previous section should appear in the Discover tab of Kibana dashboard.
Send your application logs to your own ELK stack
One of the multiple usages of the ELK stack is log parsing, storing and exploration. If you've set up your ELK stack for this, we have a beta feature called LOG DRAINS that will automatically send every log line generated by an application to an ELK stack. If you're interested by this kind of feature just contact the Scalingo team via the in-chat support or via email at support@scalingo.com.
Logs at Scalingo
Internally at Scalingo, we have been using this exact stack for more than 6 months for parsing and indexing the logs of the platform. This stack helped us to debug things way faster than we previously could and even detect issues before they had an impact on the production environment.
However, as cool as this stack is, it is not enough to be able to have meaningful report from your logs, you must log in a meaningful way. That's why the addition of this stack has been followed by many refactoring and thinking about how things should be logged. Our CTO did a talk about how we managed to have meaningful logs in a microservices environment at ParisAPI meetup (video and slides). We also released our context based extensible logging library in our go-utils repository.
Final words
Finally, in this talk we only showed you an example using the HTTP input plugin. However if you want to use beats you must be able to open raw TCP connections to your app, this is now possible with Scalingo using our TCP addon.
Cover photo by [Marek Mucha](https://unsplash.com/photos/6ZOyOk5v_PM) on [Unsplash](https://unsplash.com/)