8 min read
Collecting the requests time of thousands of applications
Learn how we gathered thousands of metrics using a single InfluxDB instance with just a few gigabytes of RAM.

When we released the Metrics panel on the Scalingo dashboard more than a year ago, we wanted to give as much information as possible to the developers regarding their applications' performances. To assist you in this matter, we just added to this panel the duration of the application's requests. This article explains how we gathered that many metrics using a single InfluxDB instance with just a few gigabytes of RAM.
When maintaining an application, a developer is interested in a few metrics to detect bottleneck, or performance issue. The Scalingo dashboard was enhanced more than a year ago with a metrics view to help developers understand their application's behavior in production. But one missing metric was the requests time, that could be interesting in the application maintenance process.
Here is what it looks like on your dashboard:
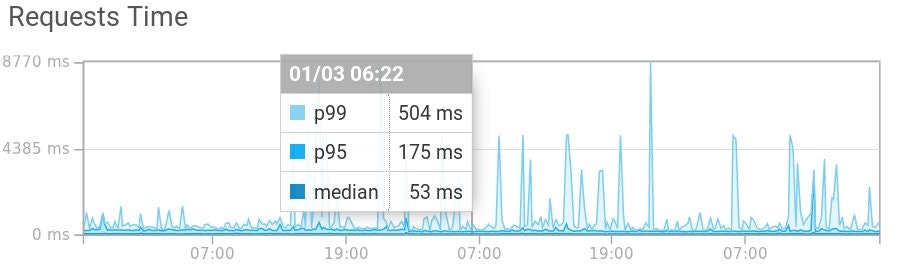
The median of the requests time along with the 95th and 99th percentile (p95 and p99) are displayed to better understand the distribution, the outliers of your requests times. From Wikipedia, a percentile is:
the value below which a given percentage of observations in a group of observations fall.
More specifically, we understand from the above example that 95% of the requests times are 175 ms or below and 99% of the requests times are 504 ms or below. What we call the median is actually the 50th percentile. Hence, in this example, 50% of our application requests times are 53 ms or below.
How does it work?
Gathering metrics for thousands of requests per minute, for thousands of applications requires to carefully think the architecture. Scalingo currently handles around 20 000 requests per minute and it is steadily growing. Storing the duration of all these requests would require a hell lot of RAM! Here is how we circumvent this, using our metrics stack.
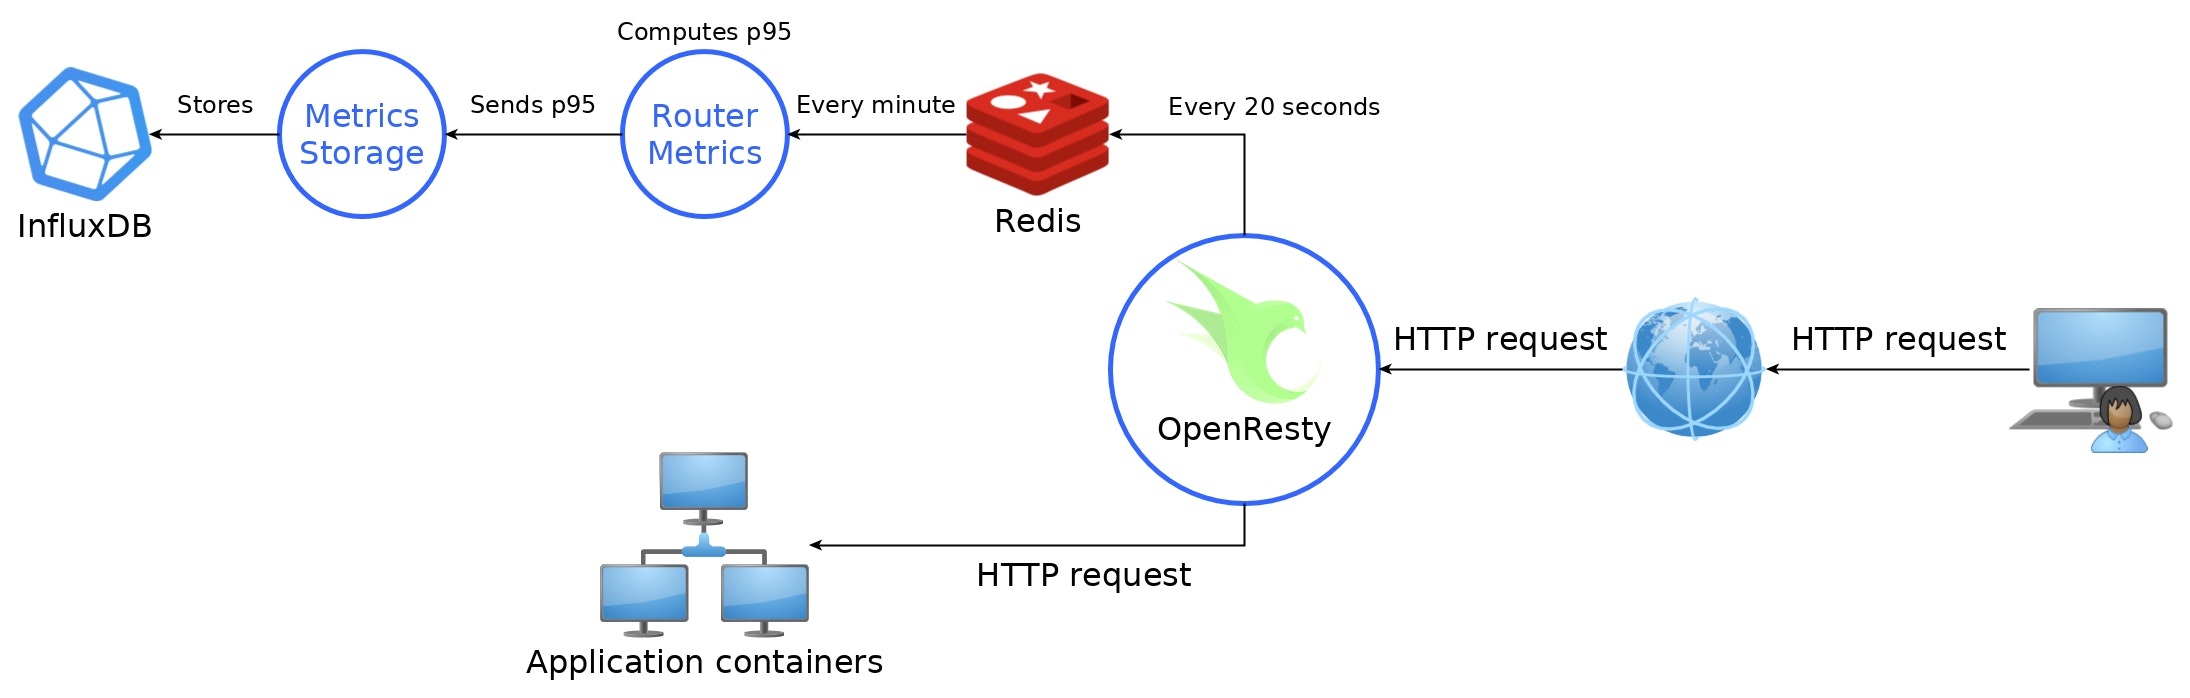
This picture represents the architecture of our metrics stack. OpenResty is the reverse proxy, entry point to all the hosted applications. Hence it is the perfect place to compute every requests duration. Whenever a request hits OpenResty, we create a new Lua light thread to handle the recording of the metrics.
These durations are stored in the RAM of OpenResty in a hash table associating an application ID with a list of requests time. This hash is flushed every 20 seconds in a Redis database.
Then, every minute, the router metrics service reads data in the Redis and computes the median, 95th percentile and 99th percentile to send them to the metrics storage service.
The metrics storage service is in charge of storing data in a time series database. This service was created so that we don't rely on a single provider of time series database. InfluxDB is currently in use but any other type of time series database could be easily implemented.
This trick lets us store 3 data points per application per minute in InfluxDB, whatever the intensity of the traffic. Such load should easily be handled by InfluxDB.
Impact on the infrastructure
Even though we took great care to devise this metrics stack, we want to ensure gathering the requests time will not impact the infrastructure: neither OpenResty with the piece of code which sends the requests time to Redis, nor the other services, including the InfluxDB database.
To measure the impact on the performance, we monitored the RAM and CPU consumption of OpenResty, the router metrics and the metrics storage services. A three steps scenario was employed to validate our approach. Every step must be validated before triggering the next step.
Deploy the same application twice. The requests time for one application are collected, and not for the other one. Both applications are queried with 150 requests per second for 5 minutes. No impact on any services or databases is noticeable.
The requests time for all our services hosted on Scalingo are collected. Below is displayed the graph for our API:
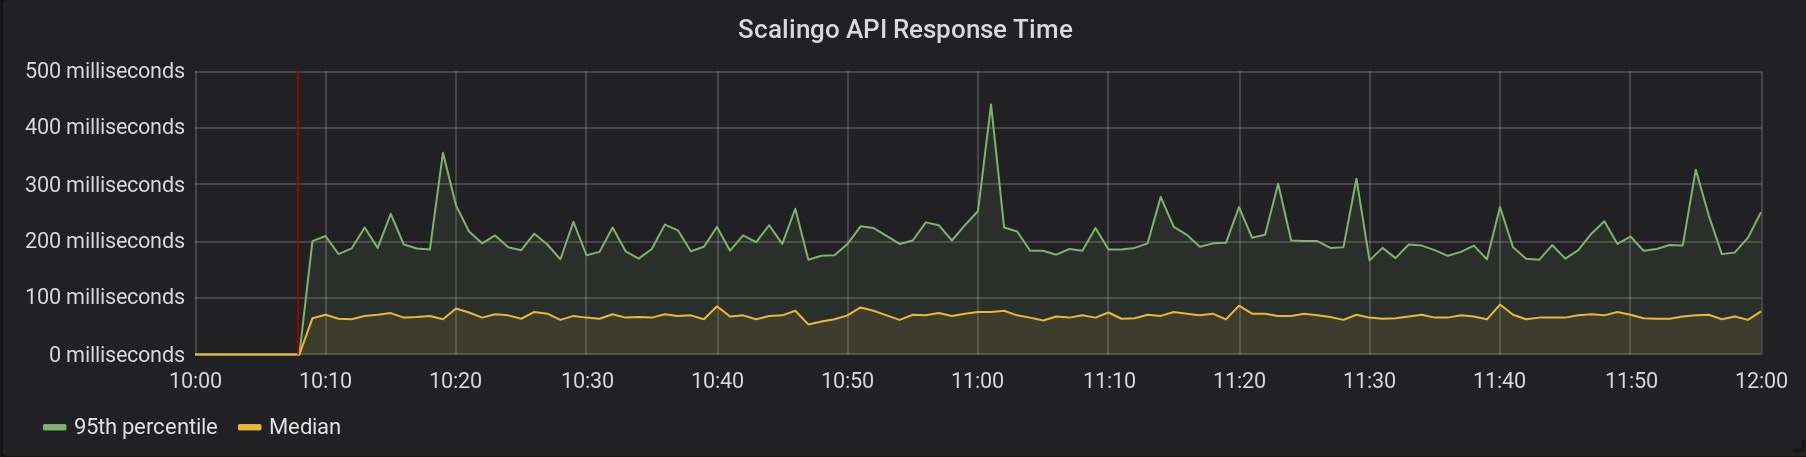
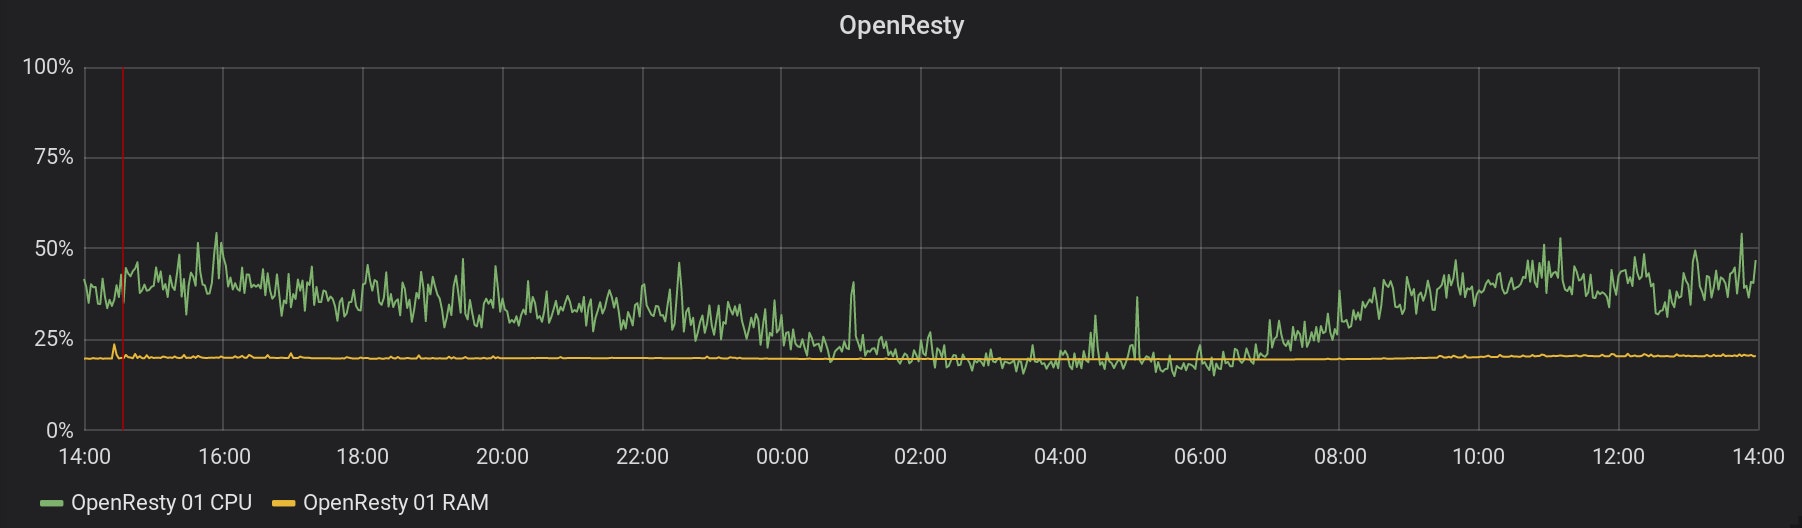
The metrics collection started at 10:08 (represented by the red line). Here is a graph of the CPU and RAM consumption of one of our OpenResty instances, during the same period:
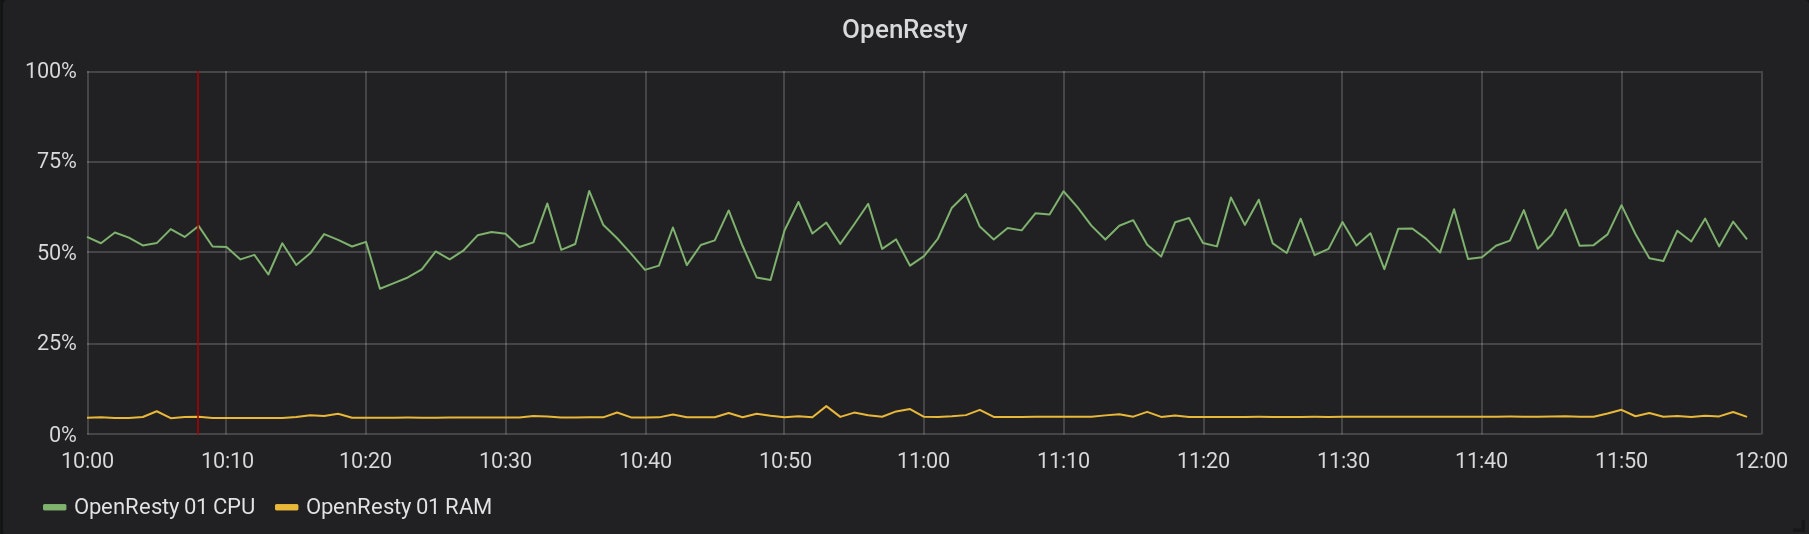
The graphs for all the running OpenResty look the same. These servers don't seem to suffer from this metrics collection! And this is the same for any services and databases implied. 3. Requests time for all applications on Scalingo are collected starting from February the 22nd at 14:32 (represented by the red line). Find below the graphs of the impact on two of the metrics stack services:
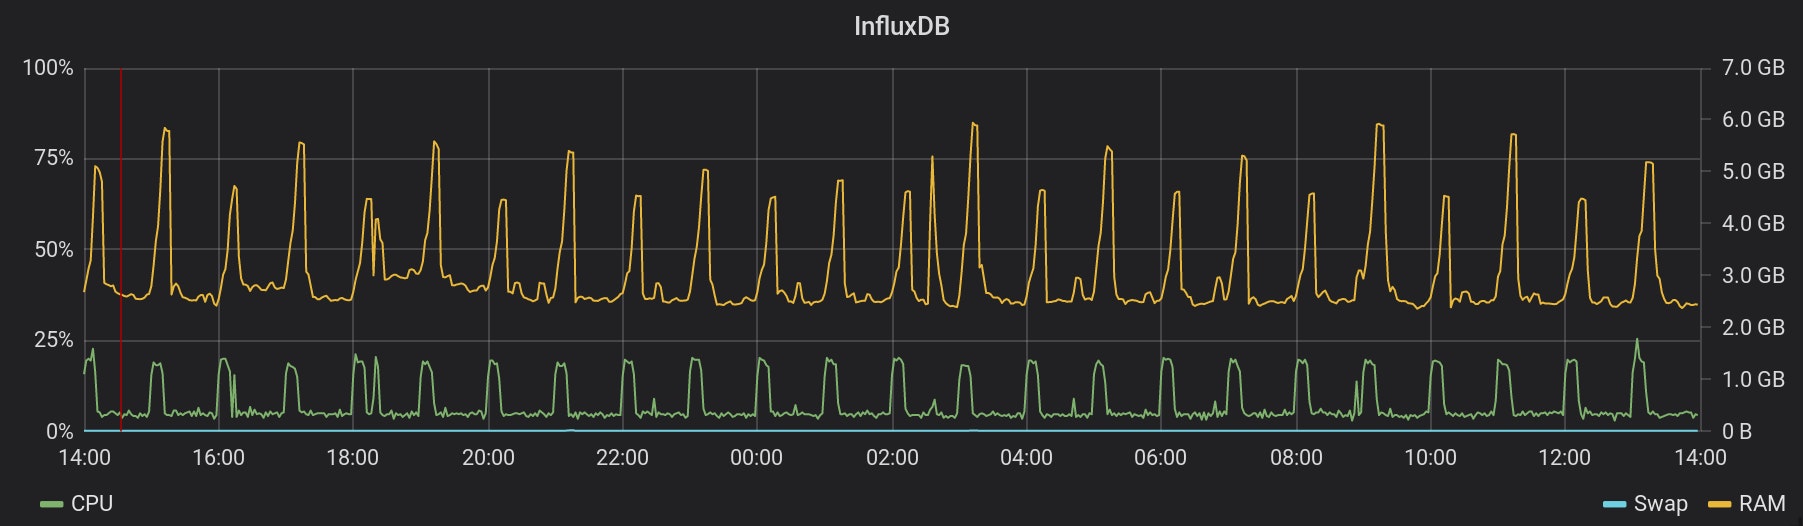
Once again, it seems our infrastructure handles this extra-load easily.
With this new metric collected by the platform, we are developing two new features that might be really useful to monitor your application. A way to trigger an alert whenever one of your application metrics goes above a certain threshold. An autoscaling service, able to scale up or down an application based on its needs, is also sprouting in Scalingo's backyard.
Stay tuned!
Cover photo by [Mitchel Boot](https://unsplash.com/photos/hOf9BaYUN88) on [Unsplash](https://unsplash.com/)

Étienne Michon
Étienne Michon is one of the first employee at Scalingo. With a PhD in computer science Étienne takes care of Research and Development at Scalingo. He also regularly contributes to this blog with technical articles.
Stay Updated
Get articles and platform updates in your inbox.
Ready to Deploy with Confidence?
Experience zero-downtime deployments, intelligent auto-scaling, and fully managed infrastructure. Start deploying your applications on Scalingo today.
No credit card required • Deploy in minutes • Cancel anytime