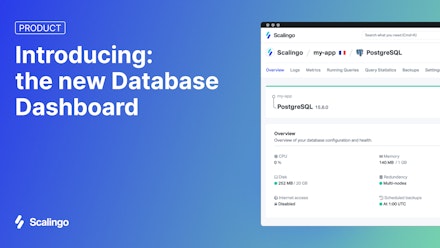
Improved Database Dashboards

We are pleased to announce some improvements on the database dashboards. We've added long awaiting features like logs and metrics display for all database addons. For Scalingo PostgreSQL users, we've also added a "running queries" panel.
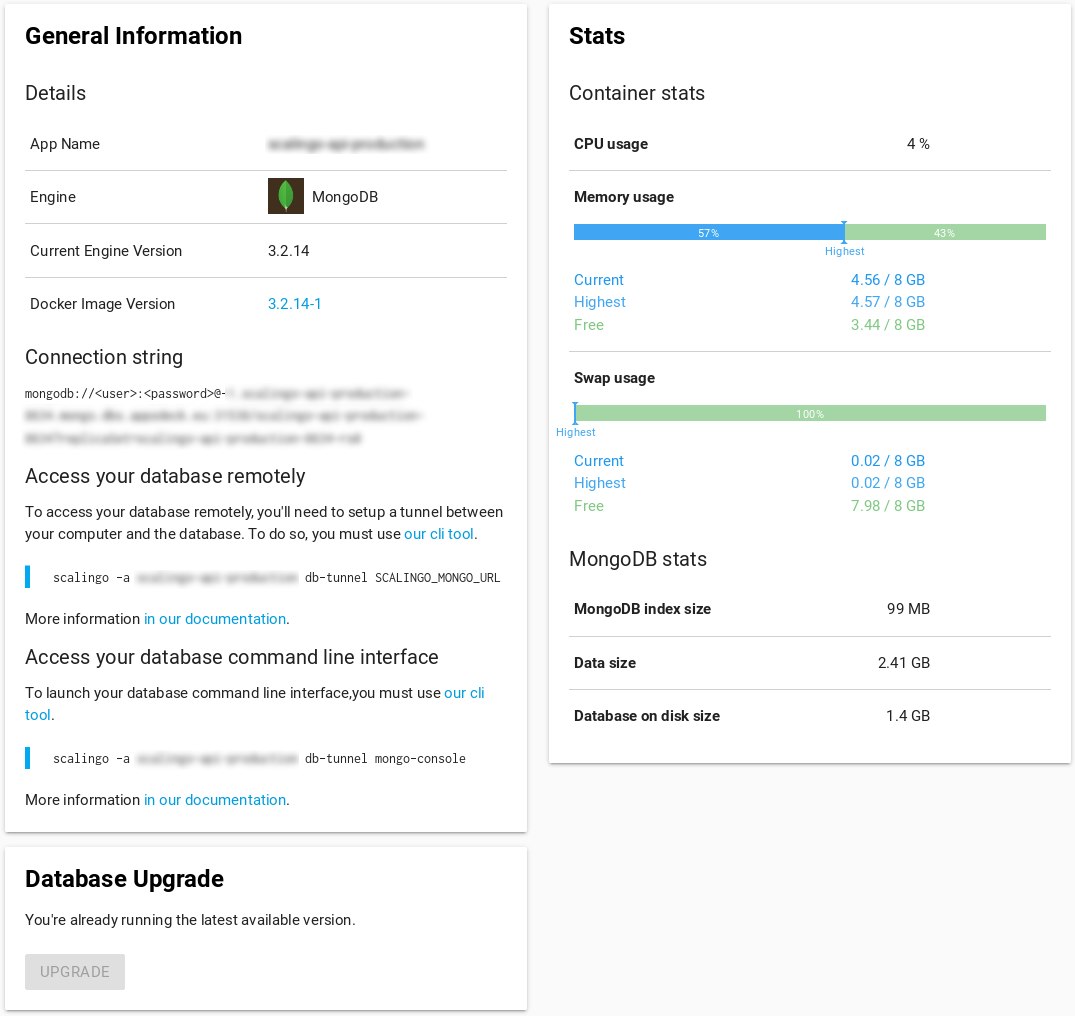
Connection Infos
Basic connection infos are now listed in the "Overview" tab. It's now more clear on how to access directly your database, either by establishing an SSH tunnel via our CLI tool or by launching an interactive console.
Metrics
The same Metrics module that you've enjoyed for 1 year is now available for your database dashboard as well:
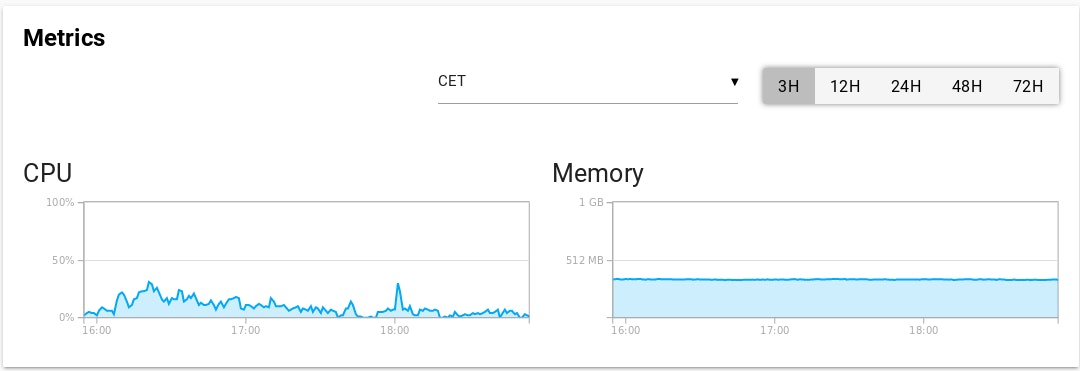
For the moment, it includes the same metrics than your application containers. It reports CPU, RAM and Swap usage and you can see the last 3, 12, 24, 48 or 72 hours in the past.
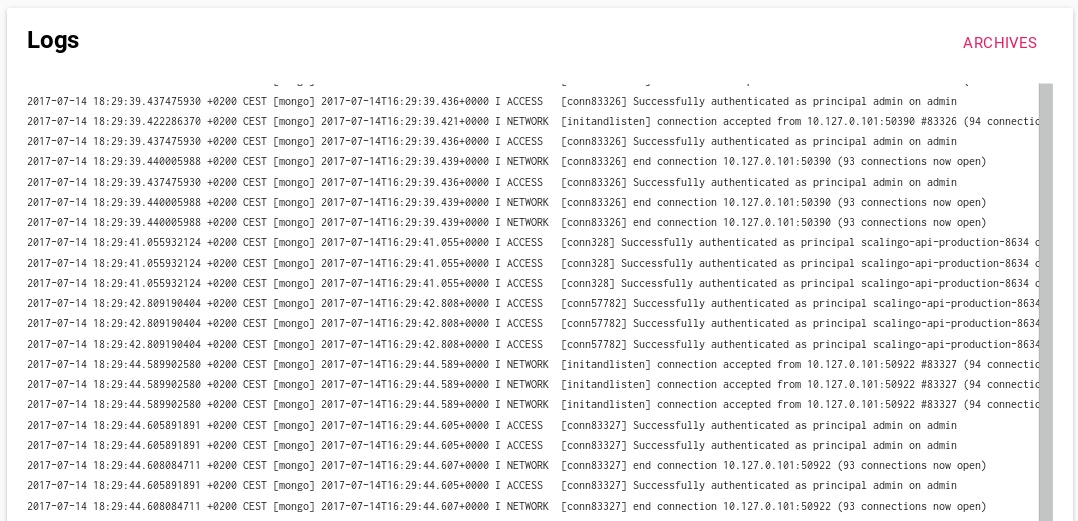
Logs
Real time logs is here as well. Very practical when you need to audit the last operations done by your database.
Running Queries for Scalingo PostgreSQL
In this round of implementation, we took extra care of PostgreSQL users with the "Running Queries" tab. It shows you the current running queries on your PG database. You can then cancel or terminate those queries (with pgcancelbackend and pgterminatebackend). With those two functions you won't be stuck anymore and you will be able to take care of your database all by yourself.

The Future
We know that having a nice view of slow queries is still missing. We'll add a new panel in the future for the Scalingo PostgreSQL addon, based on the pgstatstatements extension.
In the mean time we're hard at work to propose in the coming months multiple node setup for our database addons. Think about replica sets for MongoDB, cluster for Elasticsearch and hot standby for PostgreSQL.


