5 min read
Improving the deployment experience
These last weeks, different features have been pushed to production to improve the deployment process of your apps. Here is an overview of what has changed.

These last weeks, different features have been pushed to production to improve the deployment process of your apps. Here is an overview of what has changed.
1. Deployment tab in the dashboard
While browsing https://my.scalingo.com, you may have noticed that a new “Deployments” tab has appeared. In this part of the website, you’ll find the list of all the deployments of the selected app. Each entry includes the pusher, the person who’s run the git push operation, as well as the status, the date and the output of the deployment.
This tab is behaving in real time, if you or one of your collaborators is pushing some code, the new deployment will appear automatically and instantly. You can see an example in the following video:
All the deployments are saved, so you’ll be able to access, at any time, the past deployment outputs. It is especially useful if the build has failed and that your need to find why or if you are using a Continuous Integration solution, because in this case you don’t have the output in your terminal, so we bring it to you through the dashboard.
2. Instant output when an application failed to start
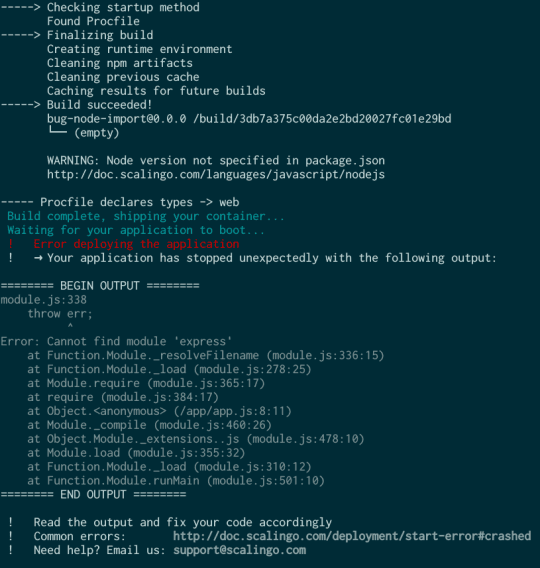
After thousands of deployments, we figured out that there was something really annoying to our users. When an application is deployed and that this one fails to start, situation which may happen if you forgot to commit a file, or if the environment of your app is not set correctly, it was difficult to find the cause of the error.
The logs of the starting application are added the the log output of your application. So to get the error message, you had to browse all the logs of your app and find something meaningful. If your application doesn’t have a lot of traffic it may be acceptable, but if tens of lines are appended, it may be very tough finding the good information.
From now, when your application fails to start, the output of the starting container is shown to you directly in the deployment output. So it is accessible from your terminal and from the “Deployments” tab of the dashboard obviously.

Thanks to this, you do not need to search for the error, we bring it to you.
A premise of the future
This is a preliminary work for a lot of other features related to deployments. It is also a first step for external service integrations like GitHub, CI platforms, and any other tool working over GIT. In these cases, consoles are not directly accessible and such interface is a must-have.

Yann Klis
Yann Klis co-founded Scalingo. Scalingo's vision is to offer a european sovereign cloud housting platform for developers. Today Scalingo hosts thousands of web applications from customers located all over the world. Before that Yann founded Novelys a web studio specialised in Ruby on Rails technology.
Stay Updated
Get articles and platform updates in your inbox.
Ready to Deploy with Confidence?
Experience zero-downtime deployments, intelligent auto-scaling, and fully managed infrastructure. Start deploying your applications on Scalingo today.
No credit card required • Deploy in minutes • Cancel anytime


