After the release of our InfluxDB addon, you may wonder if a time series database can suit your need. In this blog post, we will explain a sample of a typical use of a time series database.
An example of use
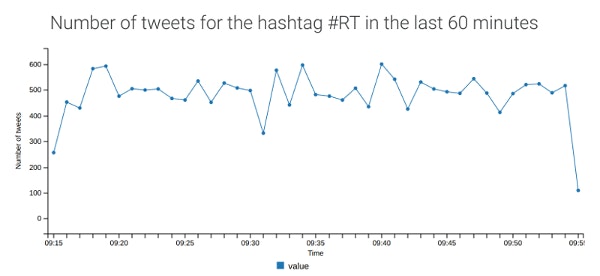
Let's go through a simple example of application using InfluxDB as a time series database. This application watches a Twitter hashtag and count how many tweets are published with this hashtag each minute. Results are displayed on a graph available here.
In this sample, different technologies are used. The backend is built with:
The wonderful InfluxDB time series database to store a new datapoint for every tweet containing the watched hashtag
A Go worker which uses the go-twitter library to subscribe to a Twitter public stream.
A Go webserver using the Martini framework.
The frontend uses the following technologies:
Pure JavaScript to display the results on a graph generated using the C3.js library.
You can view the application here and read through the code on GitHub. Here is a screenshot of this sample:
How InfluxDB is used in this sample
Data in InfluxDB is organized by time series, each of them contains a measured value. In this example, the measurement is the number of tweets, the tags are the type of tweet (i.e. tweet, DM or event) and the hashtag (so that we can watch multiple hashtags), and the only field is the measurement.
Every time a tweet is posted containing the watched hashtag, we add a datapoint to InfluxDB using the date of the tweet creation given by the Twitter API as a timestamp. This part is more thoroughly explained in the next section.
Now, in the frontend, we want to display the number of tweets every minute in the last hour. To fetch data from the database, InfluxDB provides InfluxQL, a SQL-like language. In our case, the query is easily interpreted by anyone understanding SQL:
SELECT sum(value) FROM tweets WHERE hashtag = 'RT' AND time >= now() - 1h GROUP BY time(1m) ORDER BY time DESC LIMIT 60
SELECT sum(value) FROM tweets WHERE hashtag = 'RT' AND time >= now() - 1h GROUP BY time(1m) ORDER BY time DESC LIMIT 60
SELECT sum(value) FROM tweets WHERE hashtag = 'RT' AND time >= now() - 1h GROUP BY time(1m) ORDER BY time DESC LIMIT 60
SELECT sum(value) FROM tweets WHERE hashtag = 'RT' AND time >= now() - 1h GROUP BY time(1m) ORDER BY time DESC LIMIT 60
value contains the number of tweets with the specified hashtag every second.
WHERE hashtag = 'RT' AND time >= now() - 1h filters the specified hashtag and only for the past hour.
GROUP BY time(1m) determine how InfluxDB will group the query results over time. Here we have the sum of values for every minute. More information in InfluxDB documentation.
ORDER BY time DESC LIMIT 60 to get the last 60 results. With the previous GROUP BY, this ensure we get the results for the past hour.
You can run this query using the InfluxDB console. You can get this console with the Scaling CLI:
scalingo --app sample-influxdb influxdb-console
scalingo --app sample-influxdb influxdb-console
scalingo --app sample-influxdb influxdb-console
scalingo --app sample-influxdb influxdb-console
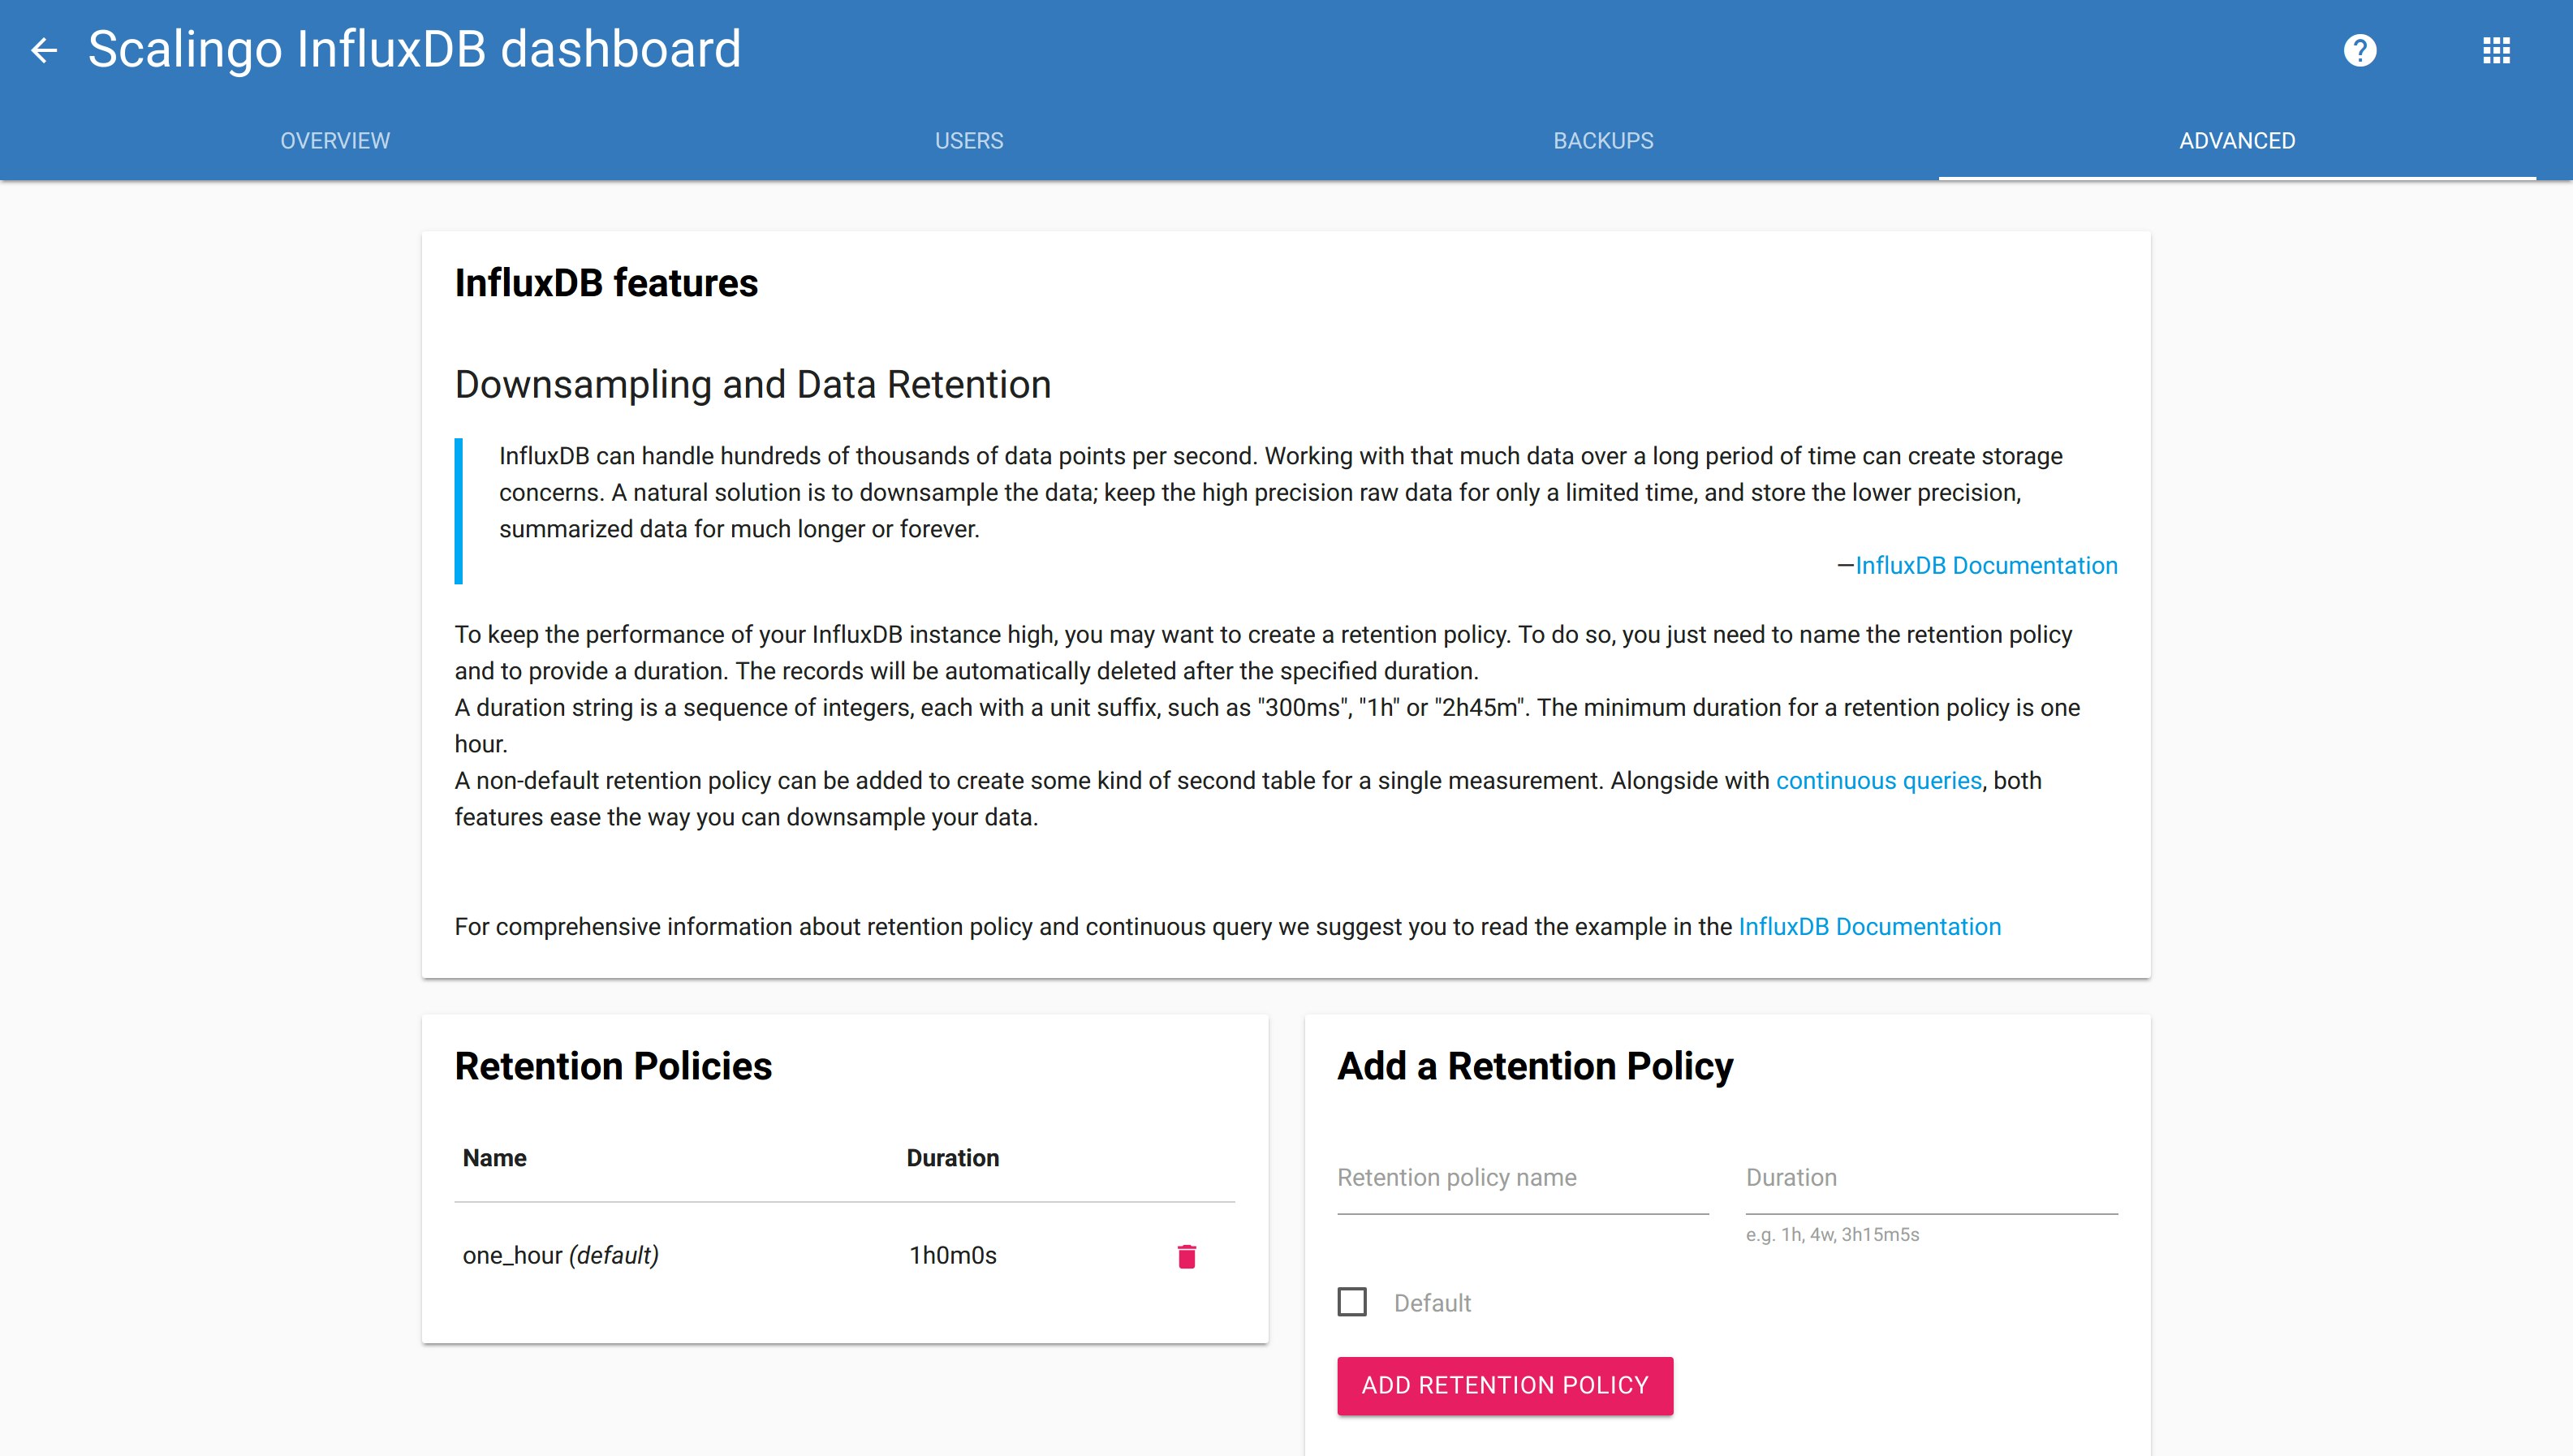
InfluxDB also provides a way to automatically delete records older than a certain date. As we do not need data older than an hour, we create a one-hour default retention policy:
CREATE RETENTION POLICY "one_hour" ON "tweets" DURATION 1h REPLICATION 1 DEFAULT
CREATE RETENTION POLICY "one_hour" ON "tweets" DURATION 1h REPLICATION 1 DEFAULT
CREATE RETENTION POLICY "one_hour" ON "tweets" DURATION 1h REPLICATION 1 DEFAULT
CREATE RETENTION POLICY "one_hour" ON "tweets" DURATION 1h REPLICATION 1 DEFAULT
Creating retention policy is not available to simple database users. If you wish to create one, you can log into your database dashboard, and go to the "Advanced" tab.
More information about downsampling and data retention is available in the documentation.
The Go part of the sample
InfluxDB provides an official library to interact with an InfluxDB server. We will show how we used it in the context of this sample. Using this library, time series data are called points. These points are written to the database using batch inserts.
Every time a tweet is posted using the watched hashtag, we increment a counter and add or update a point in the database. The following snippet shows the function called every time a tweet is posted. This code belongs to the worker of our sample.
For the sake of clarity, we skipped all the error checking in these code excerpts. Do not forget to add them in your production code...
func addTweet(createdAt, type string) {
  bp, _ := influx.NewBatchPoints(influx.BatchPointsConfig{
    Database:  config.InfluxConnectionInformation.Database,
    Precision: "s",
  })

  pt, _ := influx.NewPoint(
    "tweets",
    map[string]string{"type": type, "hashtag": config.E["HASHTAG"]},
    map[string]interface{}{"value": nbTweetsCurrentSecond},
    createdAt
  )
  bp.AddPoint(pt)

  client, _ := influx.NewHTTPClient(influx.HTTPConfig{
    Addr:     config.InfluxConnectionInformation.Host,
    Username: config.InfluxConnectionInformation.User,
    Password: config.InfluxConnectionInformation.Password,
  })
  defer client.Close()

  client.Write(bp
The config.InfluxConnectionInformation variable is of type *InfluxInfo. We filled it by parsing the environment variable SCALINGO_INFLUX_URL with the following function:
func parseConnectionString(con string) (*InfluxInfo, error) {
        url, err := url.Parse(con)
        if err != nil {
                return nil, errgo.Mask(err)
        }

        var password, username string
        if url.User != nil {
                password, _ = url.User.Password()
                username = url.User.Username()
        }

        return &InfluxInfo{
                Host:             url.Scheme + "://" + url.Host,
                User:             username,
                Password:         password,
                Database:         url.Path[1:],
                ConnectionString: con,
        }, nil
Lastly, the frontend of our application needs a way to read the data from the database. We added a GET /tweets endpoint in the webserver which returns the number of tweets every minutes for the last hour. The answer is JSON encoded to integrate flawlessly with the JavaScript library we use.
This endpoint builds and executes the InfluxQL query:
func LastMinutesTweets() ([]InfluxValue, error) {
        queryString := "SELECT SUM('value') FROM 'tweets'"
        queryString += " WHERE hashtag = '" + config.E["HASHTAG"] + "'"
        queryString += " AND time >= now() - 60m"
        queryString += " GROUP BY time(1m) fill(none) ORDER BY time DESC LIMIT 60"

        return executeQuery(queryString)
}

func executeQuery(queryString string) ([]InfluxValue, error) {
  client, _ := influx.NewHTTPClient(influx.HTTPConfig{
    Addr:     config.InfluxConnectionInformation.Host,
    Username: config.InfluxConnectionInformation.User,
    Password: config.InfluxConnectionInformation.Password,
  })
  defer client.Close()

  response, _ := client.Query(influx.Query{
    Command:  queryString,
    Database: config.InfluxConnectionInformation.Database,
  })

  if response.Error() != nil {
    panic(response.Error())
  }

  return convertResults(response
With the power of Go and InfluxDB combined, we show how easy it is to handle time series data and display them in real time on a web page. Using Scalingo, such application can be made available online in a couple of minutes.