New FinOps consumption reports

With Scalingo, it's easy to start and stop resources or dynamically autoscale your application based on the load. It's also easy to optimize your needs in temporary environments, thanks to the ephemeral deployments of Review Apps. These functions, designed for a technically-savvy audience, are the strength and fame of our platform.
However, estimating the consumption and cost of using these resources can be a difficult task. This problem arises both during the month, and when you want to measure the impact of a change in architecture, or explore your consumption data from previous months.
We understand this challenge, and are delighted to present you a new dashboard enabling you to implement a FinOps approach for your Scalingo infrastructure!
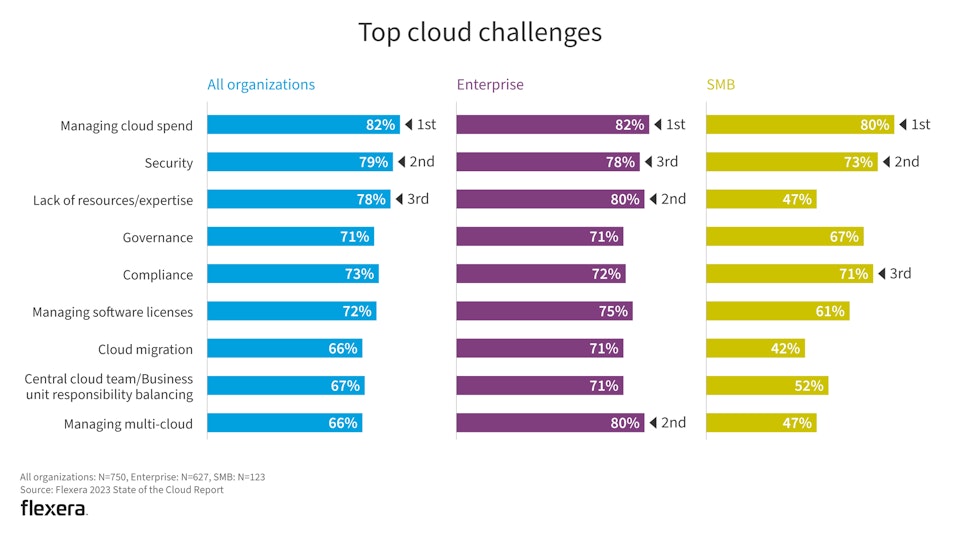
A contraction of Finance and Operations, FinOps is a governance model that focuses on the financial and operational management of your cloud resources. According to Flexera and its report "2023 State of the Cloud Report", 82% of companies using cloud services consider that managing their expenses represents the biggest challenge.

With the spread of pay-per-use and the use of elastic resources, this model is becoming unavoidable. The aim of these practices is to optimize costs, improve spending transparency and align investments with the company's strategic goals.
Access your Scalingo dashboard now to explore your data
Take the lead on your consumption
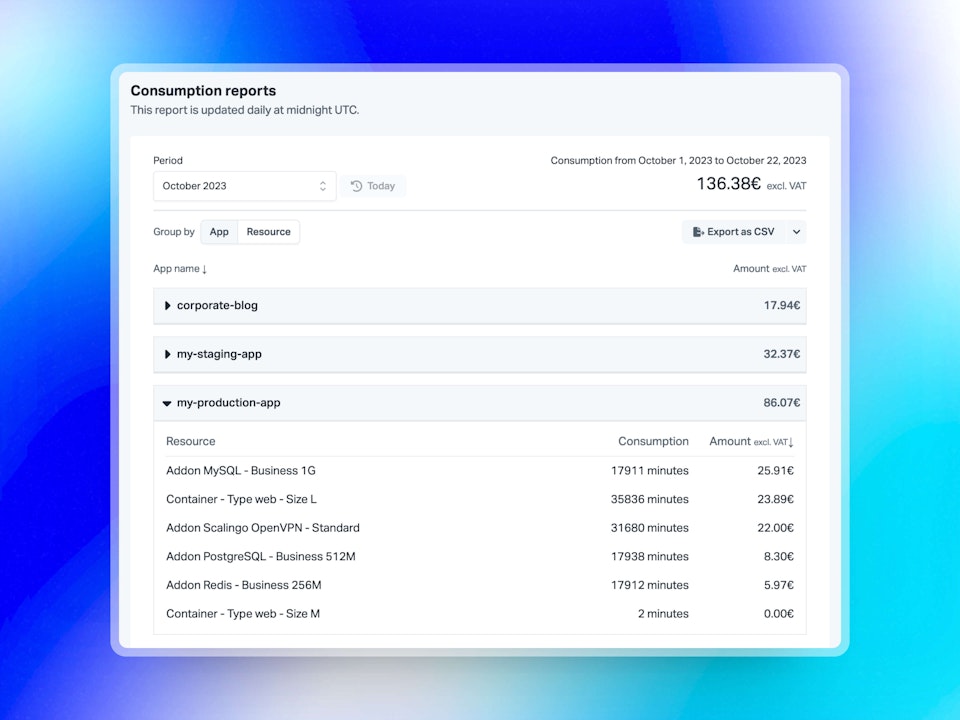
No longer wait for your invoice to inform you of your consumption in units of work (usually a duration in minutes) or in euros. This new dashboard provides you with valuable information, updated daily, to monitor and analyze your costs.

Optimize your costs
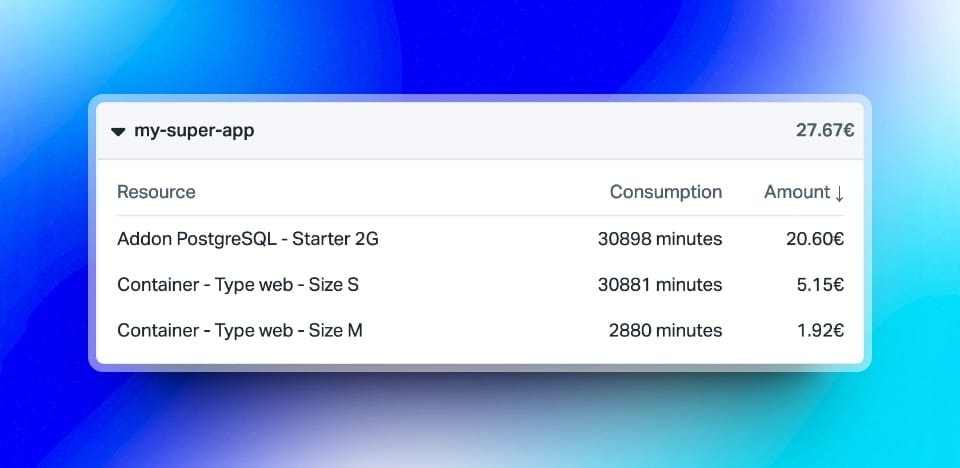
Wandering how to optimize the cost of the cloud? Easily identify the applications and resources that represent the biggest expense items and check with your technical teams, or directly in your application's Metric page, to check that they are being used wisely.
Plan on the basis of historical data
Estimate your future resource requirements based on your own history of consumption. Preparing for the next critical period in your business? Revisit previous periods to refine your forecasts. You can also import this data into your Business Intelligence (BI) tool thanks to our CSV and JSON export function.
Measure faster
Every evolution or optimization of your consumption is accessible in your daily consumption reports.

- Would you like to create a new application for a new project? The very next day, its consumption will be visible.
- Have you decided to upgrade your plan to handle a larger load in preparation for a promotional operation? This change of plan and the associated consumption will be easily identifiable.
Useful and relevant information for you
Our customers, as well as the majority of PaaS users, want managed solutions to save time, but also to limit their infrastructure costs. Understanding consumption is fundamental to effective resource management.
We value your feedback
This is the first step, and we know that your comments will help us to move towards a product that meets your needs even better.
So don't hesitate to let us know if this new consumption report meets your expectations, and to let us know what improvements you'd like to see implemented. We've already got plenty of ideas on how to improve this feature and bring you even greater satisfaction!🙂


